
|
| |||||||||||||||||||

|
Please note that JDLand is no longer being updated.
peek >>
Near Southeast DC Past News Items: assessments
- Full Neighborhood Development MapThere's a lot more than just the projects listed here. See the complete map of completed, underway, and proposed projects all across the neighborhood.
- What's New This YearA quick look at what's arrived or been announced since the end of the 2018 baseball season.
- Food Options, Now and Coming SoonThere's now plenty of food options in the neighborhood. Click to see what's here, and what's coming.
![-]()
- Anacostia RiverwalkA bridge between Teague and Yards Parks is part of the planned 20-mile Anacostia Riverwalk multi-use trail along the east and west banks of the Anacostia River.
![-]()
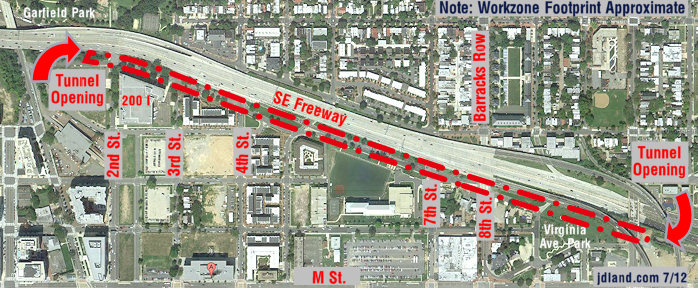
- Virginia Ave. Tunnel ExpansionConstruction underway in 2015 to expand the 106-year-old tunnel to allow for a second track and double-height cars. Expected completion 2018.
![-]()
- Rail and Bus Times
Get real time data for the Navy Yard subway, Circulator, Bikeshare, and bus lines, plus additional transit information. - Rail and Bus Times
Get real time data for the Navy Yard subway, Circulator, Bikeshare, and bus lines, plus additional transit information. - Canal ParkThree-block park on the site of the old Washington Canal. Construction begun in spring 2011, opened Nov. 16, 2012.
![-]()
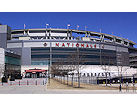
- Nationals Park21-acre site, 41,000-seat ballpark, construction begun May 2006, Opening Day March 30, 2008.
![-]()
- Washington Navy YardHeadquarters of the Naval District Washington, established in 1799.
![-]()
- Yards Park5.5-acre park on the banks of the Anacostia. First phase completed September 2010.
![-]()
- Van Ness Elementary SchoolDC Public School, closed in 2006, but reopening in stages beginning in 2015.
![-]()
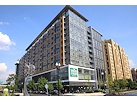
- Agora/Whole Foods336-unit apartment building at 800 New Jersey Ave., SE. Construction begun June 2014, move-ins underway early 2018. Whole Foods expected to open in late 2018.
![-]()
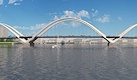
- New Douglass BridgeConstruction underway in early 2018 on the replacement for the current South Capitol Street Bridge. Completion expected in 2021.
![-]()
- 1221 Van290-unit residential building with 26,000 sf retail. Underway late 2015, completed early 2018.
- NAB HQ/AvidianNew headquarters for National Association of Broadcasters, along with a 163-unit condo building. Construction underway early 2017.
- Yards/Parcel O Residential ProjectsThe Bower, a 138-unit condo building by PN Hoffman, and The Guild, a 190-unit rental building by Forest City on the southeast corner of 4th and Tingey. Underway fall 2016, delivery 2018.
- New DC Water HQA wrap-around six-story addition to the existing O Street Pumping Station. Construction underway in 2016, with completion in 2018.
- The Harlow/Square 769N AptsMixed-income rental building with 176 units, including 36 public housing units. Underway early 2017, delivery 2019.
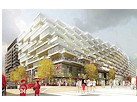
- West Half Residential420-unit project with 65,000 sf retail. Construction underway spring 2017.
![-]()
- Novel South Capitol/2 I St.530ish-unit apartment building in two phases, on old McDonald's site. Construction underway early 2017, completed summer 2019.
![Novel South Capitol]()
- 1250 Half/Envy310 rental units at 1250, 123 condos at Envy, 60,000 square feet of retail. Underway spring 2017.
![-]()
- Parc Riverside Phase II314ish-unit residential building at 1010 Half St., SE, by Toll Bros. Construction underway summer 2017.
![-]()
- 99 M StreetA 224,000-square-foot office building by Skanska for the corner of 1st and M. Underway fall 2015, substantially complete summer 2018. Circa and an unnamed sibling restaurant announced tenants.
![-]()
- The Garrett375-unit rental building at 2nd and I with 13,000 sq ft retail. Construction underway late fall 2017.
![-]()
- Yards/The Estate Apts. and Thompson Hotel270-unit rental building and 227-room Thompson Hotel, with 20,000 sq ft retail total. Construction underway fall 2017.
![-]()
- Meridian on First275-unit residential building, by Paradigm. Construction underway early 2018.
![-]()
- The Maren/71 Potomac264-unit residential building with 12,500 sq ft retail, underway spring 2018. Phase 2 of RiverFront on the Anacostia development.
![-]()
- DC Crossing/Square 696Block bought in 2016 by Tishman Speyer, with plans for 800 apartment units and 44,000 square feet of retail in two phases. Digging underway April 2018.
![DC Crossing]()
- One Hill South Phase 2300ish-unit unnamed sibling building at South Capitol and I. Work underway summer 2018.
![One Hill South Phase 2]()
- New DDOT HQ/250 MNew headquarters for the District Department of Transportation. Underway early 2019.
![New DDOT HQ]()
- 37 L Street Condos11-story, 74-unit condo building west of Half St. Underway early 2019.
![37 L Condos]()
- CSX East Residential/Hotel225ish-unit AC Marriott and two residential buildings planned. Digging underway late summer 2019.
![CSX East Residential/Hotel]()
- 1000 South Capitol Residential224-unit apartment building by Lerner. Underway fall 2019.
![1000 South Capitol Residential]()
- Capper Seniors 2.0Reconstruction of the 160-unit building for low-income seniors that was destroyed by fire in 2018.
![1000 South Capitol Residential]()
- Chemonics HQNew 285,000-sq-ft office building with 14,000 sq ft of retail. Expected delivery 2021.
![1000 South Capitol Residential]()


4 Blog Posts Since 2003
In March 2011, I posted on the proposed 2012 tax assessments for the 900-plus tax parcels that I track as Near Southeast properties, which valued the neighborhood at just a teensy bit under $6 billion ($5.994B). But there's a reason those are just "proposed": property owners need a chance to prostrate themselves before the city to try to get their assessments revised. In addition, new properties come onto the rolls during the year as projects get completed.  There were 15 properties that received reductions for their 2012 bills, totaling about $148 million. The big property owners managed a few hefty cuts, with JBG's US Department of Transportation building leading the way with a $47.7 million reduction to just under $615 million, followed by CSX's empty lots near the freeway north of I Street getting a $46.3 million haircut down to $66.2 million. Many of the other shiny new-ish buildings of the neighborhood also got their tallies reduced, such as apartment buildings 70/100 I and 909 New Jersey and office buildings 20 M, 55 M, 225 Virginia, and Maritime Plaza I and II.
So, I can now report that the 2012 tax assessment total for Near Southeast is: $6.06 billion. Since the final assessments for 2011 came in at about $5.81 billion, 2012's number is a $248 million increase for actual assessments year-over-year.
There were 15 properties that received reductions for their 2012 bills, totaling about $148 million. The big property owners managed a few hefty cuts, with JBG's US Department of Transportation building leading the way with a $47.7 million reduction to just under $615 million, followed by CSX's empty lots near the freeway north of I Street getting a $46.3 million haircut down to $66.2 million. Many of the other shiny new-ish buildings of the neighborhood also got their tallies reduced, such as apartment buildings 70/100 I and 909 New Jersey and office buildings 20 M, 55 M, 225 Virginia, and Maritime Plaza I and II. But these reductions were offset by $216 million in upward revisions. Most of this is thanks to 1015 Half Street finally being completed, taking that parcel's assessment from last year's $41.1 million to just a hair under $144 million. Three other buildings (80 M, 100 M, and 300 M) received higher final assessments as well. Plus, 32 townhouses in Capitol Quarter came onto the rolls as completed buildings, bringing just under $14 million in new tax revenue. (Yes, yes, PILOT/payment in lieu of taxes--don't stop me when I'm on a roll.)
And, because people always want to know, the ballpark's assessment for 2012 remains the smidgiest smidge under $1 billion, unchanged from 2011, at $999,982,800.
Alas, I can't give good year-to-year comparison numbers on final assessments in previous years because I didn't really grasp this whole revision thing until last year (oops), but I can say that proposed assessments were just a mite over $6 billion in both 2010 and 2011, after having been at $4.47 billion in 2009. My March post has the year-by-year proposed assessed values for the neighborhood, if you want those numbers.
If you feel like digging deeper (since you don't pay me enough to just post all my numbers for you to use), here's the the current assessments database, which you can search yourself. Tune in this March to see what the city proposes for 2013 values, and then in January for what the values really end up being....
|
Comments (0)
More posts:
assessments
|
I'll ask everyone to contain themselves as I bring the news that the city has posted its proposed tax assessments for 2012, and the tally for Near Southeast's properties as I calculate it comes to around $5.99 billion, a whopping 0.001 percent lower than last year's $6.001 billion proposed value, a number which was then revised down thanks to landowner appeals to a final 2011 number of about $5.81 billion. I've pulled together a chart of the assessed values of the neighborhoods' shiny new/ish office buildings and non-DCHA non-condo multi-unit residential buildings, showing their 2011 proposed assessment, along with the final 2011 number and today's new 2012 proposed number. The proposed 2012 valuations for this specific sub-group of properties totals $1.77 billion, which is up a tad from the $1.75 billion proposed for 2010--but which ended up being dropped to a $1.58 billion final 2011 valuation after appeals.
I've pulled together a chart of the assessed values of the neighborhoods' shiny new/ish office buildings and non-DCHA non-condo multi-unit residential buildings, showing their 2011 proposed assessment, along with the final 2011 number and today's new 2012 proposed number. The proposed 2012 valuations for this specific sub-group of properties totals $1.77 billion, which is up a tad from the $1.75 billion proposed for 2010--but which ended up being dropped to a $1.58 billion final 2011 valuation after appeals.The expansion in the neighborhood's tax base in terms of new residents has become clear as well: Looking at the numbers for the Capitol Quarter and Velocity condos parcels: in 2007, before construction got underway, they were assessed at around $92 million; for 2012, the proposed value is around $282 million. (It should be noted that Capitol Quarter's taxes don't go into the general fund, because owners there actually are governed by a Payment in Lieu of Taxes [PILOT] structure that uses the tax proceeds to pay down the debt on the bonds used to finance the development.)
As for the number everyone always wants to know about: Nationals Park remains valued at $999,982,800, unchanged since the first time the ballpark's assessment appeared, back in 2009.
| Yearly Near Southeast Proposed Assessments
2002: $221M *
2003: $428M *
2004: $642M
2005: $771M
2006: $896M *
2007: $1.78B
2008: $2.54B
2009: $4.47B
2010: $6.01B
2011: $6.00B
2012: $5.99B
* Includes a mix of proposed and revised assessments |
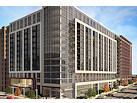
And it's likely that the neighborhood will continue to be home to the most valuable privately held property in the city, as the US Department of Transportation HQ has been assessed at $662.7 million, about $73 million higher than the final 2011 number that made it the most valuable property in the city in 2010, according to WBJ.
I keep a database of neighborhood assessments going back to 2001, although it only took about eight years for me to grasp the concept that the proposed numbers released in March aren't always the final ones, so it was just in 2010 that I started tracking both proposed and year-end numbers. (Though it must be said that during the Bubble Years, landowners weren't quite so vigorous about challenging their assessments.) Plus for a long time I got the years wrong when referencing: numbers posted by the city in one year are labeled as being the proposed/actual value for the following year. And some tax squares inside my strict Near Southeast boundaries escaped my attention for a few years early on. But I don't think the numbers are so out-of-whack that they can't be compared in a general way, as long as you keep the caveats in mind; with that admonition, check out the table at right for the yearly numbers.
And, of course, it should be noted that since large portions of the neighborhood's land is owned by the Feds (*cough*Navy Yard*cough*), there aren't taxes being paid on every dime of these assessment numbers.
If your envelope hasn't already arrived, or if you want to see how your number stacks up against your neighbors, you can search the assessments database yourself.
|
Comments (0)
More posts:
assessments
|
It's assessment season again, and the Examiner reports that, citywide, commercial property assessments are down 10 percent, with residential numbers dropping between three and four percent. So I fired up the database I keep of the numbers for Near Southeast, added the new data as I do each year when the new numbers come out, and came up with a total assessed value for all properties of just under $5.9 billion, which is a 1.8 percent drop from the $6.01 billion tally reported in March of 2009.
But, wait! As I dug a little further, I found a flaw in my methodology that hadn't quite occurred to me before this year (though it probably hadn't been an issue too often before now): 11 of the big commercial buildings in Near Southeast had apparently appealed their initial 2010 assessments (sent out last year), lowering their tax bills by between 2 percent and 38 percent, from a combined $1.13 billion in the initial assessments to $909.36 million post-appeals. (Ten other buildings are showing no change in those assessments, and one--909 New Jersey--actually saw an 8 percent bump upwards, which was probably more of a function of the initial estimate being from before the building was completed.)
Taking these changes into account, the total assessments for 2010 for the neighborhood is closer to $5.88 billion, meaning that tally of the 2011 numbers just released of $5.89 billion would actually be a 1.9 percent increase. Except that I imagine that some property owners will be appealing again (since some of the 2011 numbers go right back to the original 2010 numbers that were appealed), and the $5.99 billion number will come down again.
Not all property in the neighborhood took a hit--with the opening of the first portions of Capitol Quarter, the blocks between Fourth and Fifth Street saw an increased value of $33 million, and the completion of Velocity raised the assessed value of its block from $99 million to $162 million.
And, since everyone will want to know: the behemoth of the area--Nationals Park--has an assessment unchanged from last year, at just a hair under $1 billion.
I'll check the numbers again later this year to see how many proposed 2011 assessments get altered.
Here's a quick table of the big properties that saw their 2010 assessments change from the original number released early in 2009:
| Property | Original 2010 | Revised 2010 | % Diff. | Proposed 2011 | |||||
| 300 M | $132.26M | $82.00M | -38% | $74.69M | |||||
| 55 M | $162.60M | $110.66M | -32% | $110.66M | |||||
| 80 M | $124.08M | $92.75M | -25% | $111.27M | |||||
| 100 M | $90.98M | $68.18M | -25% | $90.98M | |||||
| 1201 M (Martime #1) | $87.97M | $72.57M | -18% | $64.74M | |||||
| 1100 NJ | $142.79M | $121.40M | -15% | $139.16M | |||||
| 100 I | $85.20M | $73.00M | -14% | $85.20M | |||||
| 70 I | $132.28M | $119.00M | -10% | $132.28M | |||||
| 1000 NJ * | $84.46M | $81.06M | -4% | $79.75M | |||||
| 770 M (Blue Castle) | $23.93M | $23.17M | -3% | $23.93M | |||||
| 1220 12th (Maritime #2) | $66.99M | $65.57M | -2% | $47.57M | |||||
| 909 NJ | $68.05M | $73.58M | 8% | $79.93M | |||||
| * This is for the residential portion of Capitol Hill Tower; the 2010 assessments on the Courtyard by Marriott show no change. | |||||||||
|
Comments (0)
|
It certainly doesn't feel like it's the case, so you might be surprised to find out that the District of Columbia thinks that Near Southeast is worth about $1.5 billion more than it was a year ago, at least in terms of the latest tax assessments now available. With a total assessment last year of around $4.5 billion for the blocks bounded by the SE Freeway, South Capitol Street, and the Anacostia River (to just west of the Sousa Bridge), this bump up edges the neighborhood's "worth" to just over $6 billion.
A chunk of that change is coming from the first official assessment of Nationals Park, valued at $999,982,800 (geez, Mr. Tax Assessor, just round it to $1 billion and be done with it), a rise of nearly $650 million from the assessed value of just the land last year. Blocks that saw projects get completed in 2008 (70/100 I, 100 M and Onyx, and 55 M) got hefty bumps in their valuations, while other spots (20 M, the Capper blocks, USDOT, Maritime Plaza) saw their assessments go down.
I created a report comparing 2008 and 2009's numbers overall and by block, though I wouldn't swear to the exactness of each number down to the penny (but they're probably close enough).
As for the trend of the overall valuation of Near Southeast over the past nine years, it's still *up*:
2001: $221,096,652
2002: $428,312,487
2003: $640,209,280
2004: $771,006,345
2005: $894,123,520
2006: $1,781,481,650
2007: $2,539,618,280
2008: $4,467,137,880
2009: $6,004,334,490
UPDATE: Here's a link to a map of the square numbers, in case a bit more visual assistance would be helpful.
|
Comments (0)
More posts:
100 M, 20 M, 70/100 I, assessments, Capper, US Dept. of Transportation HQ, jpi, Maritime Plaza, Monument Valley/Half St., Onyx, Square 743N, Nationals Park
|